Weekly Calorie Average: Why It Beats Daily Totals
A weekly calorie average is the total of your logged days divided by the number of logged days. It steadies the ups and downs of single days, so it tells you more about your habit than any one day does. Look at the average first and at single days only to find out why it moved. Skip the days you did not log; do not count them as zero.
Key takeaways
- One day is noisy. A big dinner or a skipped lunch moves a single day a lot and a week only a little.
- Divide by the days you logged, not by 7. An unlogged day is missing data, not a zero-calorie day.
- Compare the average with your goal. Remembite counts a day as on target when it lands within 10 percent of the goal.
- Read 7 days for what is happening now, 30 days for your habit and 90 days for the direction.
- An average is only as good as the log behind it. Partial days and weekends can skew it.
Why does a weekly average beat a single day?
A day depends on things that do not repeat: a dinner out, a long workout, a late start. A week contains most of those, so they partly cancel out. The average moves slowly and answers the question you care about: what do I usually eat?
The same holds for body weight. A study of 80 adults, with 4,657 daily weight measurements, found a weekly cycle: on average weight was higher early in the week, started rising on Saturday and started falling on Tuesday (Orsama et al., Obesity Facts, 2014, opened 2026-10-14). The authors say weekend-weekday swings should be seen as normal variation, not as weight gain, as long as they are offset during the week. If weight has a weekly rhythm, a single weigh-in or a single day of food is a poor basis for a decision.
How do you work out your average calories per week?
Add the calories of every day you logged. Divide by the number of those days. The example below is made up to show the arithmetic.
| Day | Logged kcal (example) |
|---|---|
| Monday | 2,100 |
| Tuesday | 1,850 |
| Wednesday | 2,300 |
| Thursday | 1,950 |
| Friday | 2,050 |
| Saturday | 2,600 |
| Sunday | not logged |
| Average of 6 logged days | 2,142 (12,850 / 6) |
| Wrong: divided by 7 | 1,836 (12,850 / 7) |
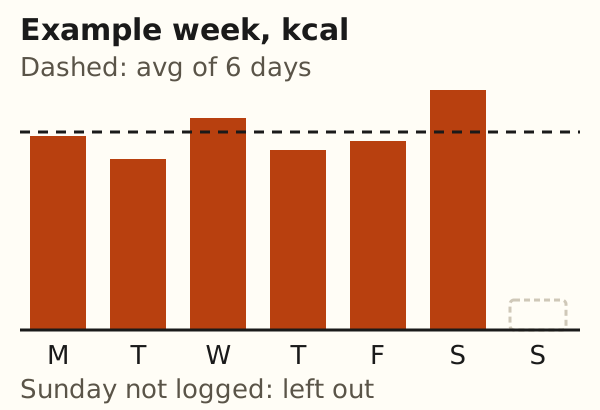
Dividing by 7 makes the week look 306 kcal lighter, only because Sunday is missing. A missing day tells you nothing about what you ate, so leave it out and show the count of logged days next to the average.
How does the average compare with your goal?
Put the average next to the goal you set. In the example, a goal of 2,000 kcal and an average of 2,142 differ by 142 kcal, or 7 percent.
Then count the days. Remembite calls a day on target when its calories fall within 10 percent of the goal, which is 1,800 to 2,200 kcal for a 2,000 goal. In the example week, Monday, Tuesday, Thursday and Friday qualify, so 4 of 6 logged days. Wednesday and Saturday do not. The average can look fine while two days are far off, so the average and the day count answer different questions. The 10 percent band is a counting rule we picked, not a health limit.
How do you read 7, 30 and 90 day charts?
| Window | Use it to see | Watch out for |
|---|---|---|
| 7 days | What this week looks like now | A single odd day still moves it |
| 30 days | Your usual pattern, including weekends | A holiday or trip can dominate it |
| 90 days | The direction over a season | Old habits you have since changed |
Compare windows with each other. A 7-day average well above the 30-day one tells you this week is unusual. A 30-day average that stays level while the 90-day one drifts says your habit changed some weeks ago. Look for a shift that lasts a few weeks before you react to it.
Where does an average mislead?
- Forgotten or partial days. A day with only breakfast logged counts as a low day. It pulls the average down.
- Weekends. If Saturday and Sunday differ from weekdays, a 7-day window shows the mix, and a window that starts mid-week shows a different mix.
- Estimates. Each day is itself an estimate. Averaging smooths random noise but does not remove a consistent bias, such as logging cooked rice as raw. See how to check an AI calorie estimate and how big the error is in calorie counts.
- Body weight. Scale weight moves with more than food, so a weight line beside your calorie line is a hint, not a verdict.
What does Remembite show?
Your own record has this in its dashboard. The sample dashboard shows the History layout on sample data.
The History view has a calories chart and separate charts for protein, carbs and fat. You pick 7 days, 30 days, 90 days or all. Each chart carries its average in the heading, and your goal appears as a dashed line when you have set one. The average divides by logged days, and the view says how many days that is. A stats row shows the 7-day average, the last 7 days against the 7 before, and how many logged days landed within 10 percent of your calorie goal. Over 120 days, each point on the chart is the average of one week's logged days.
You can also ask your AI. Remembite gives it a summary for up to 92 days: average nutrients per logged day, the number of days logged, how many days were within 10 percent of the goal in effect, and the five most logged foods. The numbers in the log are the ones your AI sent, so the checks on single meals still matter. More on charts is on the features page. For the same idea applied to your own habits, see food logging for the quantified self and macro tracking for lifters. To compare other ways of keeping a log you can average, read macro tracking without an app. For the bigger picture of logging with an AI, see AI food logging explained.
Estimates, not medical advice. How the numbers work.
Start your own record
Create a free account with your email, then add Remembite to Claude. Want to look first? Watch Claude log a sample day, no account needed.